On October 21, gold, this ancient safe-haven asset, staged a dramatic "high dive".
London spot gold prices plunged as much as 6.3% during the session, ultimately closing down 5.31%, marking not only the largest single-day drop in 12 years but also the 15th largest single-day decline on record. This sudden and massive shock was even noted by Goldman Sachs. Traders described it as a "crash like a speculative stock".
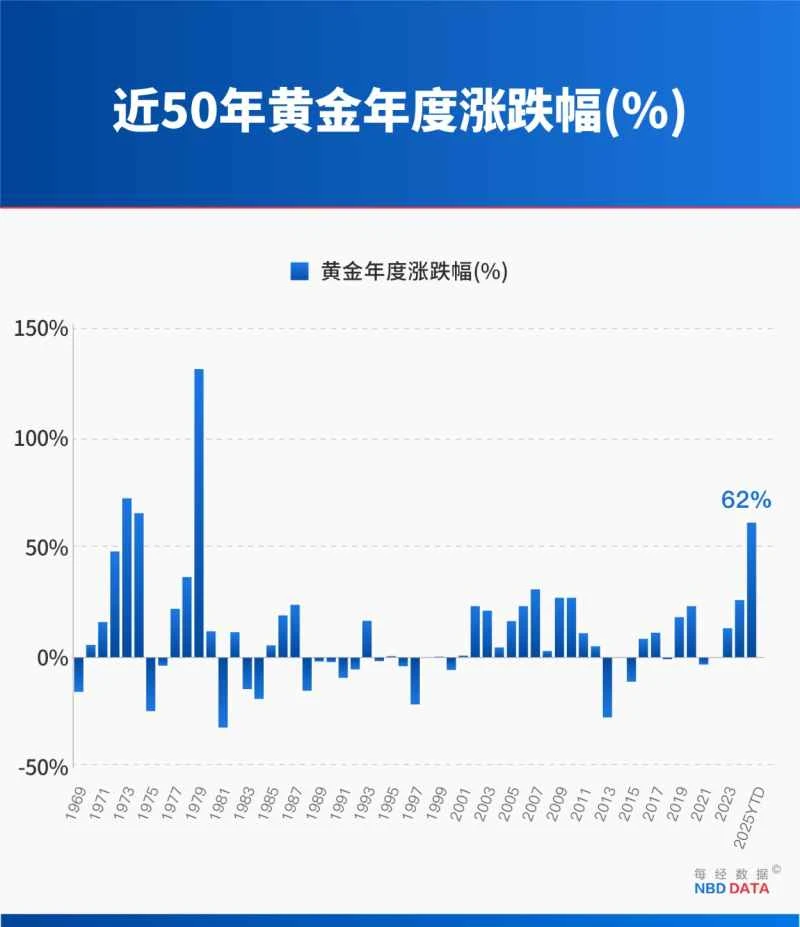
Since its intraday high of $4,375.59 per ounce on October 21, spot gold has fallen by nearly $268 per ounce, a cumulative drop of 3.35% this week, closing at $4,107.92 per ounce, ending a nine-week winning streak.
However, this seemingly sudden "crash" was not without warning. A series of technical indicators had already sounded the alarm. So, is this a healthy correction within a long-term bull market for gold, or the beginning of a complete reversal of the frenzy?
A review of 14 historical instances of sharp single-day drops in gold prices by reporters from the Daily Economic News (hereinafter referred to as Daily Economic News reporters) revealed a clear divergence in their subsequent price movements.

Four major alarms have already been sounded.
Before the gold market took a sharp turn for the worse, multiple technical indicators had already issued clear warning signals from different perspectives.
First, the market witnessed an unusual combination of simultaneous rises in US stocks, gold and silver, and the US dollar. (Minsheng Securities) In his research report, analyst Shao Xiang pointed out that before the sharp decline, the market experienced a rare situation that subverted traditional financial logic. He believes that this combination of simultaneous asset price increases is unsustainable and foreshadows a short-term adjustment in the market structure.
Secondly, the gold market itself is already in an "extremely overbought" state. (Guojin Securities) The report points out that there are still clear signs of overbought conditions in both the short-term and long-term prices of gold, and in the past, gold prices have pulled back when such phenomena have occurred.
In terms of short-term gains, London spot gold has hit 45 new historical highs this year, with prices rising by about 30% since August 21, a first in the recent gold bull market.
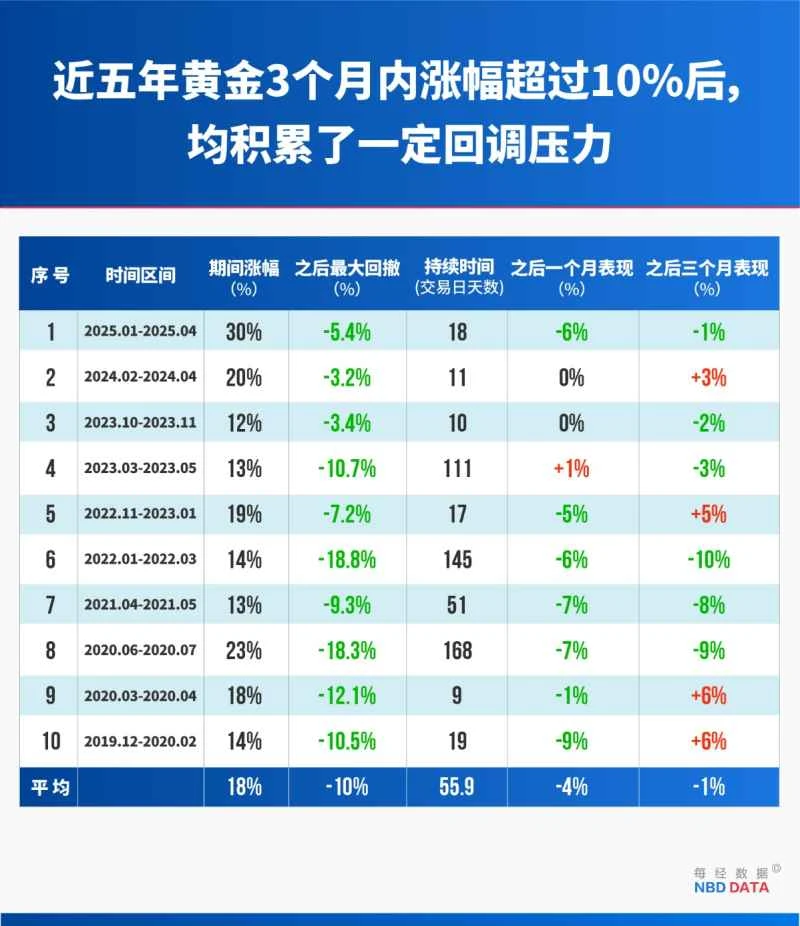
Based on observations over the past five years, the upper limit of each short-term rapid rise in gold prices is typically around 30%, with an average pullback of 4% in the month following the end of the surge. Historically, considering both the magnitude and speed of the rise, the recent increase in gold prices may have already been relatively substantial. Guojin Securities believes that the main reason for the sharp drop in gold prices on October 21st was a technical correction following previous overbuying.
Third, the technical outlook for gold is nearing its limit. (Guoxin Securities) A retrospective analysis using three standard deviations as the upper limit for short-term gold price increases reveals that since 2010, each time gold has reached this upper limit, a certain degree of pullback has occurred, and the current upward trend has reached this critical point. A breakout of this technical indicator often signifies the unsustainability of a short-term upward trend.
Another key warning sign comes from the surge in implied volatility of gold ETFs. Historical experience shows that a sharp rise in implied volatility usually occurs at short-term turning points and when trends are exhausted. In this round of market movement, implied volatility has recently surged significantly, providing a clear warning of an impending sharp correction.
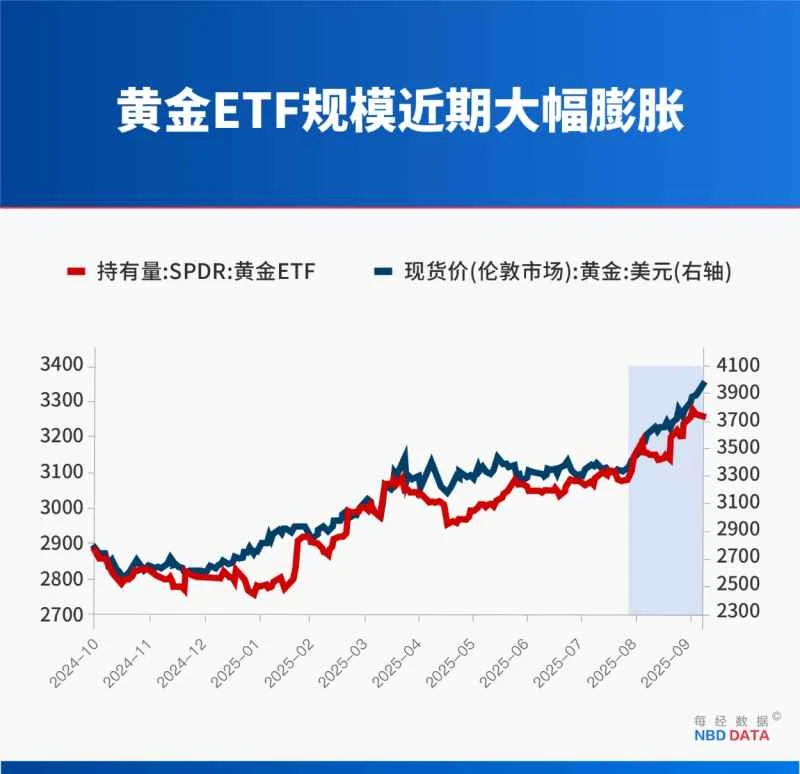
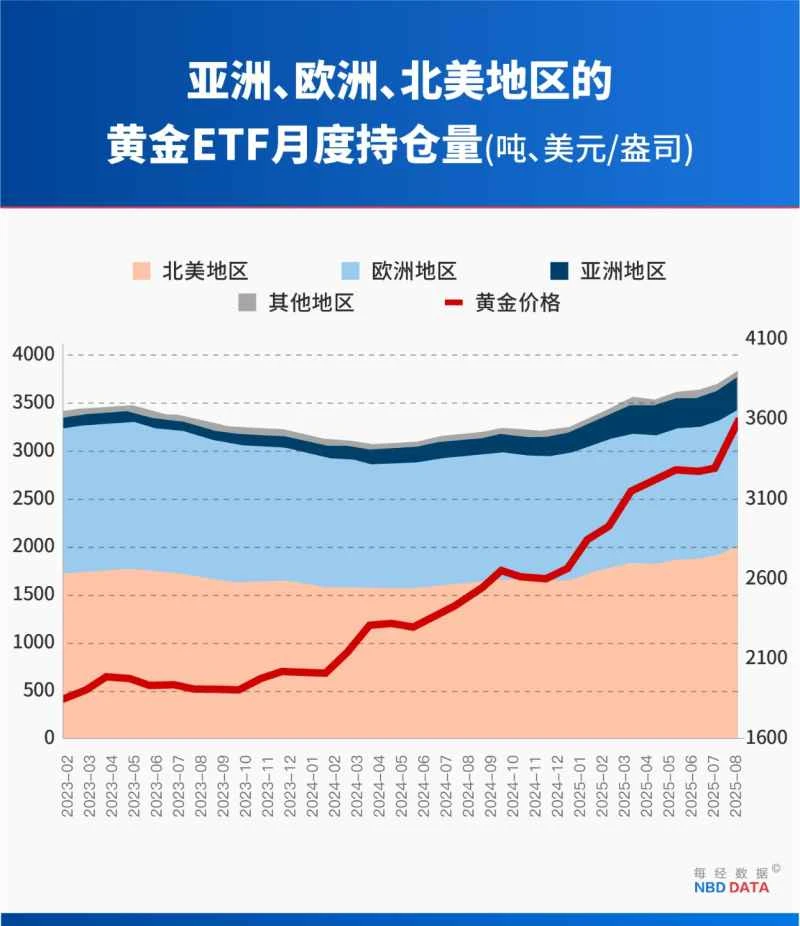
Fourth, the size of gold ETFs has expanded significantly during this round of gold price increases, which is a key difference from the trading situation at the beginning of the year. This trading structure makes it more likely that this round of increases will end in a sharp decline.
Chen Hanxue, a macroeconomic analyst at Guojin Securities, summarized to the reporter from National Business Daily that the recent decline in gold prices was due to both technical factors and short-term driving forces. The decline in risk aversion is attributed to several factors. Technical factors include excessive trading congestion and rapid short-term price increases, while narrative factors include changes in events such as the Russia-Ukraine conflict, which have led to a decrease in risk aversion.
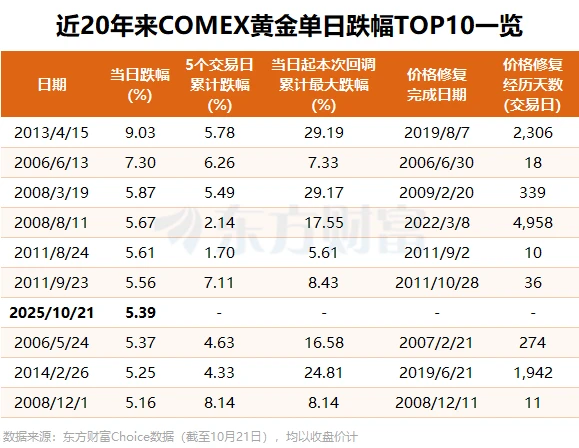
Historical Lessons: A Retrospective of 14 Major Gold Price Drops
Is this sudden shock a correction in the middle of a bull market, or a trend reversal that marks the end of the frenzy?
Historically, there have been 14 instances where a single-day drop exceeded the drop on October 21, 2025 (5.31%).
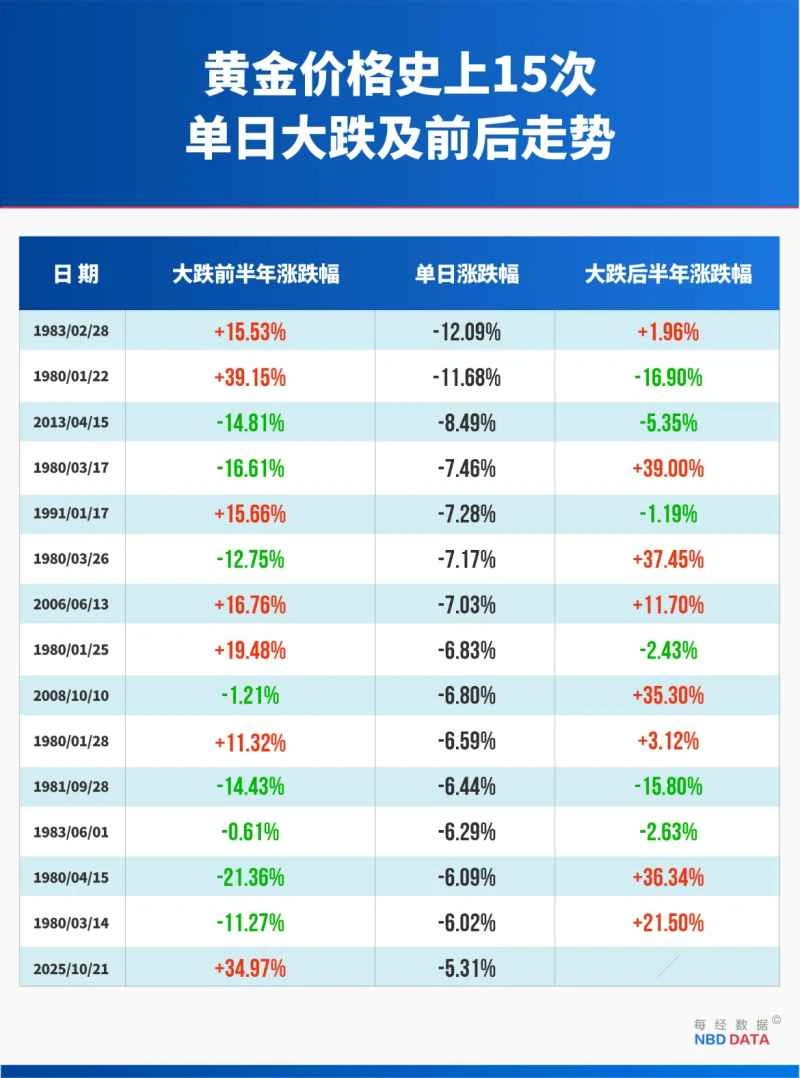
Six of these instances were similar to the current situation, namely, gold prices were in a sustained upward trend for six months prior to the sharp drop. However, the subsequent price movements after these six single-day plunges showed significant divergence:
On three occasions, gold prices rebounded within the following six months, with the largest rebound reaching 11.7%; on the other three occasions, prices continued to fall, with the largest drop reaching nearly 17%. A particularly alarming historical case occurred on January 11, 1980. At that time, before recording a single-day drop of 11.68%, gold prices had accumulated a gain of 39.15% over six months—strikingly similar to the 34.97% gain before this recent sharp drop. In the six months following that sharp drop, gold prices fell by a further 16.9%.
In eight other instances, gold prices were in a downtrend six months prior to a major single-day drop, and subsequently rebounded significantly within six months. For example, in the six months leading up to the major drop on April 15, 1980, gold prices had fallen by a cumulative 21.36%, but rebounded by 36.43% in the six months following the drop.
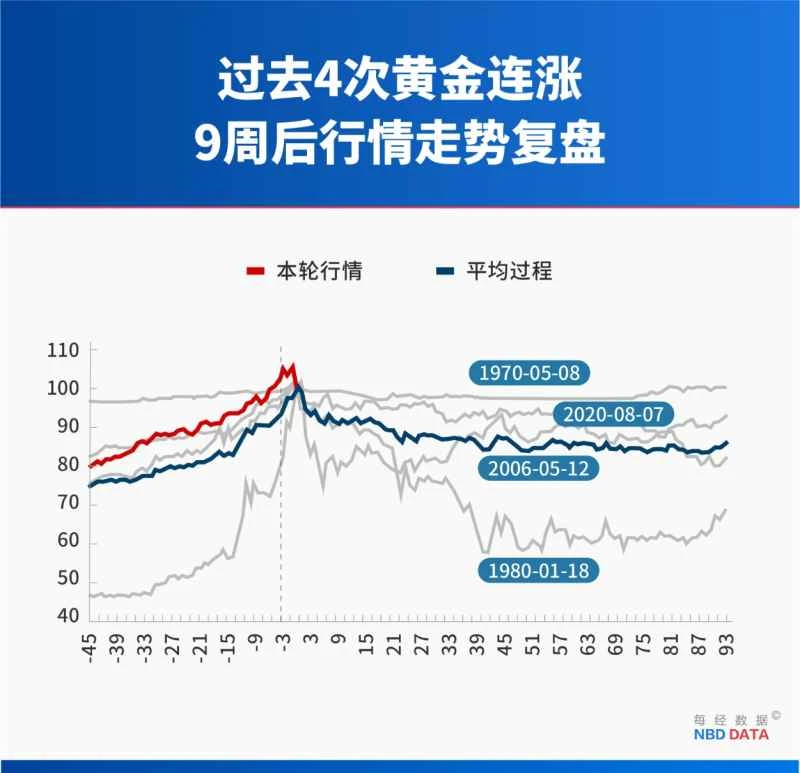
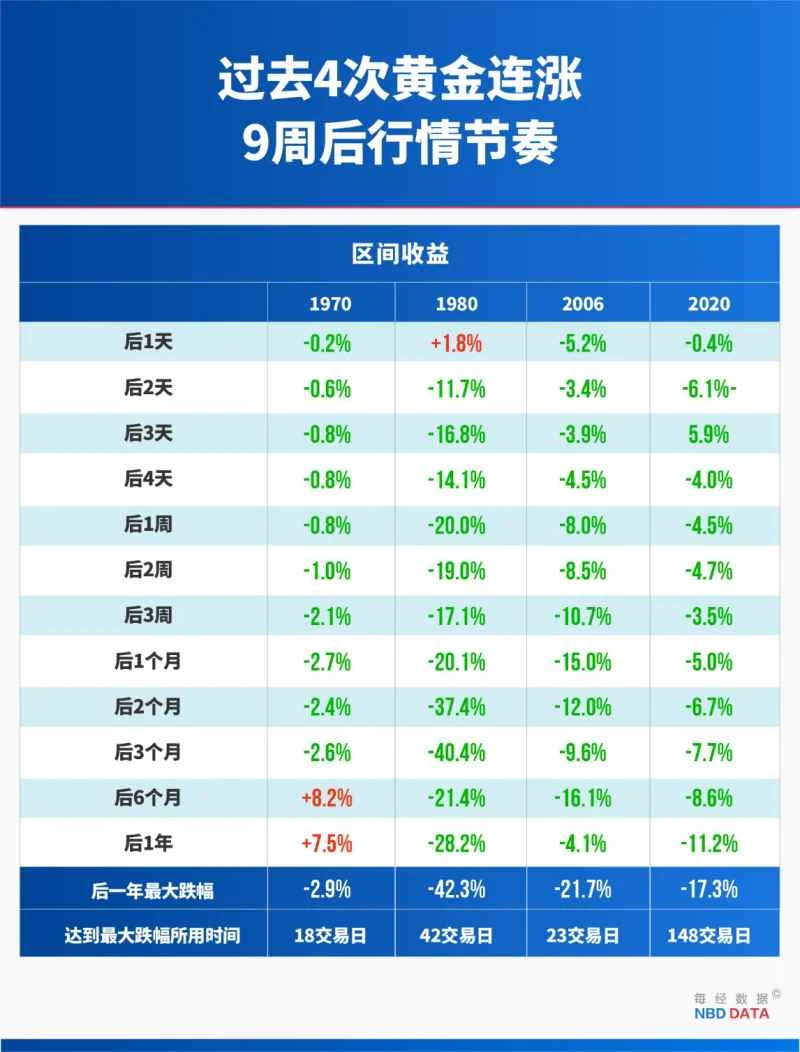
Historical data also shows that after nine consecutive weeks of gains, the largest drop in gold prices is usually between 17% and 42% (except for 1970), and in terms of duration, the largest drop generally occurs 23 to 148 trading days after the turning point.
Wall Street Debate: "Meme Stocks" or "Healthy Correction"
Following the sharp decline, Wall Street was embroiled in a heated debate between bulls and bears.
PIMCO co-founder and Wall Street billionaire Billionaire known as the "Bond King" Gross has criticized gold, traditionally considered a safe-haven asset, claiming it has gained "meme stock" status this year. Goldman Sachs, a long-time bull on gold, also believes that gold's price chart looks like a crashing "meme stock."
Joe Tigay, portfolio manager at Rational Equity Armor Fund, is also bearish, believing there is currently excessive enthusiasm surrounding gold and warning against the precious metals market. There is a bubble. "Physical gold purchases have reached frenzied levels."
“I’ve been bullish on gold for years, but what I’m seeing now is keeping me up at night,” he wrote. “What worries me is that everyone is talking about how dangerous stocks are, that we’re in a bubble. But what about gold? Gold has become a ‘risk-free’ trade. Yet nobody questions whether it’s overvalued. That’s exactly when you should be questioning it.”
However, JPMorgan Chase The analysts maintained a bullish outlook on gold in a report released on October 23, believing that the current pullback is simply the market digesting the rapid gains since August. Natasha Kaneva, the bank's global head of commodities strategy, stated, "If you're paralyzed by fear right now, that's actually quite normal because gold prices have risen so quickly… It's really a very pure logic: lots of buyers and hardly any sellers."
JPMorgan Chase predicts that gold prices will rise further as the market enters a Fed rate-cutting cycle, potentially reaching an average of $5,055 per ounce by the fourth quarter of 2026.
In response, Chen Hanxue told the reporter from National Business Daily that this decline was a healthy correction, and gold's long-term safe-haven status remained unaffected. "As long as the backdrop of global stagflation, international instability, and the monetization of the US deficit remains unchanged, gold, priced in US dollars, will continue its long-term upward trend. Gold, as a physical asset that hedges against the long-term depreciation of the dollar's credit, is pricing in chaos. "
Chen Hanxue further stated that gold is expected to fluctuate widely over the next 3-6 months. The current loose monetary environment will provide support for gold; hedging demand for AI will also benefit gold. Looking further ahead, under the pressure of next year's midterm elections, the White House will have the incentive to further seek interest rate cuts and stimulate the economy, which may be priced into a crisis of Fed independence, thus further benefiting gold. "However, a rapid short-term rise also faces short-term technical selling pressure, as seen on October 21st."
Guoxin Securities pointed out in its research report that long-term factors such as global currency restructuring, de-dollarization, central bank gold purchases, and supply-demand imbalances support the unchanged logic of the gold bull market. However, short-term downward pressure has accumulated.
A dramatic plunge, the most severe in 12 years, has placed both long-term gold believers and short-term speculators at a crossroads. Early warnings from four key technical indicators clearly revealed the technical inevitability of this correction. A review of 14 similar historical crashes reveals the immense uncertainty surrounding the post-crash trajectory of a bull market.
Dongcai Illustrated Guide: Some Useful Tips
(Source: Daily Economic News)