This round of global easing may have peaked. The current question is when, or even if, the currently soaring financial markets will begin to feel the pressure?
According to Bank of America Statistics show that global central banks have cut interest rates more times in the past two years than during the 2007-09 global financial crisis. Although this statistic only reflects the number of rate cuts rather than the extent of easing, it is still a "remarkable achievement" in the context of the epic rate hike cycle in the fight against inflation in 2022-23.
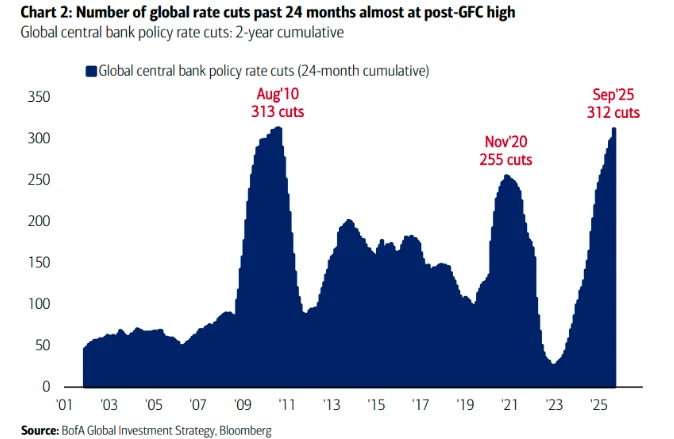
However, the easing cycle now appears to have reached a turning point after its peak. As shown in the chart below, the number of global central bank interest rate cuts on a 12-month rolling cycle may have peaked.
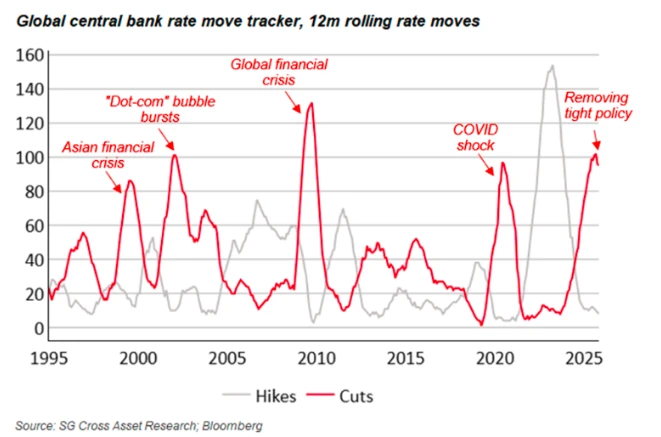
This does not in itself mean the end of global easing policies—central banks such as the Federal Reserve may still cut interest rates further, but the cumulative number of rate cuts globally is likely to gradually decrease.
As for what this change means for global financial markets, it is perhaps worthwhile for investors to consider in advance…
The peak of an easing cycle does not necessarily mean a decline in corporate profits.
On the surface, many investors' first reaction might be that the end of ultra-loose monetary policy means tighter financial conditions, which would be detrimental to the market.
However, historical experience often proves unexpected – after the peak of the past three global easing cycles, corporate profit cycles have often continued to expand, and the stock market has also been able to achieve steady growth.
Société Générale Analysts say the peak of the easing cycle may actually be a positive sign for Wall Street – indicating that earnings growth will expand and accelerate.
Manish Kabra, head of U.S. equity strategy at Societe Generale, said the peak of an easing cycle is a "strong signal" to diversify investments into market sectors such as small-cap and low-leverage stocks. He emphasized that reducing equity exposure is typically only considered when investors begin pricing in the start of a rate hike cycle.
Of course, there is one big difference between today and those historical periods: stock prices and valuations today.
In September 2009 and August 2020, Wall Street was just beginning to recover from historic crashes, and now US stock prices are at all-time highs. Given the current market valuation bubbles, this time it may not be so easy to achieve our goals – which may suggest that a more defensive risk strategy is more appropriate now.
However, Kabra downplayed the bubble theory. Looking at earnings metrics, the S&P 500's earnings growth rate this year is approximately 12%, but if stocks related to the "AI boom" are excluded, the growth rate would plummet to 4%.
Does it all ultimately come down to liquidity?
Overall, almost all major asset classes have risen this year, except for oil, the US dollar, and some long-term bonds. Even US Treasury bonds, which have been neglected and criticized in recent years, have seen a significant rebound.
Globally, these rallies are driven by a variety of factors. In the stock market, artificial intelligence... The booming economy has injected strong momentum into Wall Street, expectations of a significant increase in defense spending have boosted European stock markets, and the prospect of large-scale fiscal easing has driven up the performance of stock indices in Asia.
However, Standard Chartered Bank It is believed that a major common force driving the booming development of all these markets is liquidity—abundant liquidity.
Eric Robertsen, the bank's global head of research and chief strategist, points out that the broad-based market rally since the April lows—encompassing stocks, bonds, commodities, and cryptocurrencies—can be viewed as a "financial environment trade." In a world shrouded in extreme economic and geopolitical uncertainty, what, besides liquidity, could drive almost all asset classes to rise in tandem?
Of course, liquidity is not solely determined by monetary policy, nor is it even the primary factor. Bank reserves, private sector credit supply and demand, and overall risk appetite are all key elements constituting this ambiguous concept.
However, if interest rate changes are viewed as a rough substitute indicator or directional signal for liquidity, the market is indeed at a turning point.
Robertsen points out that the "ample" liquidity created by frequent interest rate cuts over the past 12 months has completely offset investors' concerns about growth. However, if the liquidity taps open and close—even if it's just a gradual tightening—investors' risk appetite will be tested.
"Can the market continue to thrive at such a 'high altitude' in a hypoxic environment?" Robertsen asked.
People may soon witness the answer to this question with their own eyes...

(Article source: CLS)